Across the manufacturing industry, we are living in a data-rich world, which is both a blessing and a curse. Data can take many forms and often changes as the needs of business change. At one end of the spectrum, we have hand-drawn, manually collected metric charts. These progress all the way to advanced MRP systems that can turn reports in visualisation resources to make graphs of anything you want, but too much data quickly becomes noisy and un-actionable, so which metrics do you need to focus on?
The importance of measuring has often been commented in the TXM articles and about what you should monitor from a systems perspective, but what about monitoring the creation of this information and data itself, in your operational performance? Once metric systems have been established we can start to share some specific metrics and guidelines that help our teams to measure and improve their operational performance by looking at how the data is collected and what trends these show.
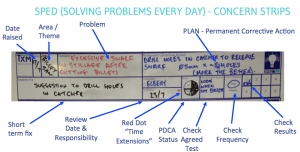
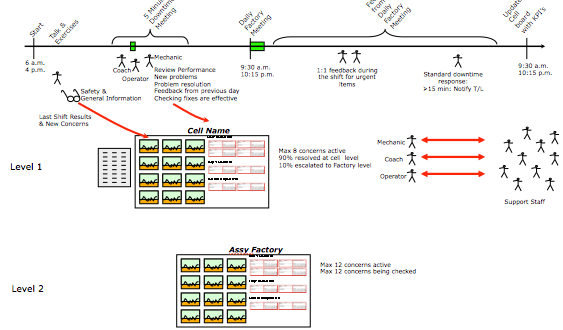
This article will focus on the metrics and systems we create around Solving Problems Every Day (SPED) and Concern Strips as the key element of SPED.
What is the “Raw Incident Count” for Concern Strips
A spike or continuous upward trend in the number of concern strip actions a team creates tells you two things: either that team’s infrastructure has a serious problem, or their monitoring tools are misconfigured and need adjustment. Concern strip actions may rise as an organisation grows, but real concerns per team should stay constant or move downwards as the organisation identifies and fixes low-quality alerts, builds standards, automates common fixes, and becomes more operationally mature. When looking at incidents, it’s important to break them down by team or service, and then drill into the underlying incidents to understand what is causing problems. Was that spike on Wednesday due to a failed deploy that caused issues across multiple teams, or just a flapping monitoring system on a low-severity service? Comparing incident counts across services and teams also helps to put your numbers in context, so you understand whether a particular incident load is better or worse than the organisation average. this can also lead to tracking the numbers of open, progressing, close and those needing escalation.
Measure Average Time to Resolution
Time To Resolution (TTR) is important for operational readiness and is measured when the concerns strip process is established with the team’s standard approach to problems solving. Understanding when the incident occurs and how long it takes for your team to fix it is a critical measure we can monitor. For example, downtime not only hurts your revenue but also the ability to meet customer delivery expectations, so it’s critical your team can react quickly to downtime incidents where concerns strips are raised. While time to resolution is important to track, it’s often hard to make this the normal practise in a company as they focus on developing the actions to correct concerns in the first place.
Investigating large differences in TTR helps with understanding the complexity of the production team environment, the way teams and support people are organised, types of industry processes, and potential impacts on a quality system. Then efforts can be directed to creating standardised work instructions, infrastructure automation, reliable alerting and escalation policies will all help drive the average TTR number down.
Measure Time to Response
This metric is often forgotten– the actual time to takes for a team to acknowledge and start work on resolving a problem. It is difficult to capture accurately however the Time to Respond is important because it will help you identify which teams and individuals are prepared for being on-call. Fast response time is an indication that the culture of operational readiness is present, and teams with the attitude and tools to respond will have the attitude and tools to recover faster. Testing, direct observations and auditing can help understand what this time frame is or tracking the time it takes for the organisation to roll out a change in procedure – a good example would be safety alert or addition inspection checks.
While an incident responder may not always have control over the root cause of a particular incident, one factor they are 100% responsible for is their time to acknowledgement and response. Experienced teams have high expectations for their time to respond, and hold themselves accountable with the standards for response time that they, themselves have developed.
Dealing with Escalations
For many companies, having to agree on a manual escalation process can be difficult and hard to manage. An escalation is an indication that either a responder wasn’t able to get to an incident in time, or that they didn’t have the tools or skills to work on it. Often an escalation can be a normal part of the process such as the need to past new method through Engineering or Quality, for their input to solving team-based problems. Understanding your escalation procedure is a valuable part of concern strip management. Teams should generally be trying to drive the number of escalations down over time.
Conclusion
Having your Problem Solving Every Day process well established, with the concern strips process running effectivity within your production team, these metrics indicate how your team are finding, responding and resolving concerns inter production areas. They can then be used to help your team refine their problem-solving skills.
If you need help with implementing your Problem Solving Every Day process, give your TXM Consultant a call. We LOVE solving problems!