Surely everyone knows what is a value stream map?
At least you would expect Lean practitioners and Lean consultants to know? Sadly, I find that is not the case and I find all sorts of process maps being described as a value stream map.
So, in this blog I want to take you back to basics and describe what is a value stream map.
What is a Value Stream Map?
It is over 20 years since Jim Womack and Dan Jones introduced Value Stream Maps (VSM) to us in “Lean Thinking”[i] and almost as long since John Shook and Mike Rother taught us how to draw them in “Learning to See”[ii]. Therefore, you would think that the need to answer the question posed by the title of this blog is long past.
Where Were Value Stream Maps First Created?
Like most elements of Lean, Value Stream Maps originated from the Toyota Production System. At Toyota they were called Material and Information Flow Analysis diagrams (MIFA).
MIFA (Material and Information Flow Analysis)
It’s worth remembering this as some lean consultants will try and tell you that MIFA Diagrams are different to value stream maps – they are not – they are two names for the same thing. As I understand it from my Toyota friends, MIFA diagrams were not required in the Toyota assembly plants, because assembly lines tend to have built in flow.
However, when the Toyota supplier development teams started working with suppliers they found a diverse range of processes operating. They needed a tool to be able to analyse all these suppliers’ manufacturing processes and understand how they connected to Toyota’s process. Hence MIFA diagrams were developed to show the supplier’s material and information flow and how that connected to Toyota. This then made it easier to diagnose and address problems at the supplier that might impact the Toyota assembly plants.
What About the Name Value Stream Maps?
This name was coined by the team at the Lean Enterprise Institute – Womack, Jones and Shook. It communicated the concept that value stream maps measure the creation of value (and waste) through a business from its suppliers to its customers.
What are the Elements of a Value Stream Map?
To make your process diagram a value stream map and not just a flow chart or (worse) a vaguely related collection of coloured post-it notes on a wall, your value stream map MUST have the following elements:
- It must map the product flow from receipt of raw materials at the receiving dock through all the value-adding and non-value adding steps in the business until the goods are ready to ship to the customer. You can map beyond that – upstream and downstream of your operation – but the “dock to dock” flow is the minimum.
- It must map the information flow at least from receipt of the customer order to the preparation of documentation to ship the goods to the customer. Again, you can go further than this and start with the quotation and design processes if you wish.
- Product flow is typically shown from left to right across the bottom of the process, although the normal way to draw it is to start with the customer (in the top right-hand corner of the map) and work backwards.
- Information flow is usually drawn from right to left, starting from the customer.
- The map must include data about what the customer requires in terms of volume, product mix, service level expectations and delivery arrangements.
- It must include data on the individual processes including value-added and non-value added time, cycle time, change over time, uptime performance or other metrics that characterise the performance of that process.
- It must highlight the inventory between each step of the process.
- It must show how processes connect. What is the nature of the flow of product and information from one process to the next.
- It must show the total lead time for the process and highlight the value-added and non-value added time.
Without all these elements, what you have drawn may look nice and may be useful, but it is not (in my view) a value stream map.

The Steps in Creating a Value Stream Map
1. The Team
Creating a value stream map is best completed by a small (usually less than 10 people) cross-functional team that represents the key functions involved in the end-to-end flow.
In a manufacturing flow, a value stream map team would normally involve production, production planning, purchasing, customer service, sales and supply chain. Other functions such as finance and engineering can be included depending on your structure and business needs.
Value stream map team members need to have a good understanding of the detail of the process, but also include individuals with the authority to make changes to the process.

2. What Are You Mapping?
Once you have formed the team, you need to decide what you are mapping. This is often done using a “product family matrix”. This is a chart that groups your different products according to the steps that they flow through.
All the products that flow through the same or similar process steps are grouped together and called a product family. Typically, you will need to complete one value stream map for each product family. The product family matrix would also include customer data such as the volume of products or services sold, product mix, order sizes and service requirements such as lead time.
You also need to define the scope of the value stream. This includes where the value stream will start and finish (usually the minimum is from receiving dock to shipping dock) and what you will include in the information flow. Information flows can become very complex so you may choose to exclude financial processes, quoting, QC processes or engineering processes if you need to.
In this case, you would just focus on the information flow required to fulfill orders and control the flow of product and material through the process.
3. Current State Map
At TXM Lean Solutions, we start the mapping process by getting the team together and introducing the concepts of value stream mapping and then developing the outline of the product flow and information flow as it operates now.
We call this the current state map. At this session, we would then agree with what data we need on the individual processes and the overall flow to complete the current state map. We would assign individuals the responsibility to gather this data.
4. Completion
We then give the team some time (usually one to two weeks) to gather this data.
When we get the team together again to complete the current state map by adding in the process data and calculating the overall metrics for the value stream, especially the lead time. If necessary, it is possible to overlay other metrics on the value stream such as cost, quality and on-time in-full delivery performance at each step.
Improving Your Value Stream
Once you have completed the current state map, the next step is to work out how you can improve your value stream. This is called the future state map.
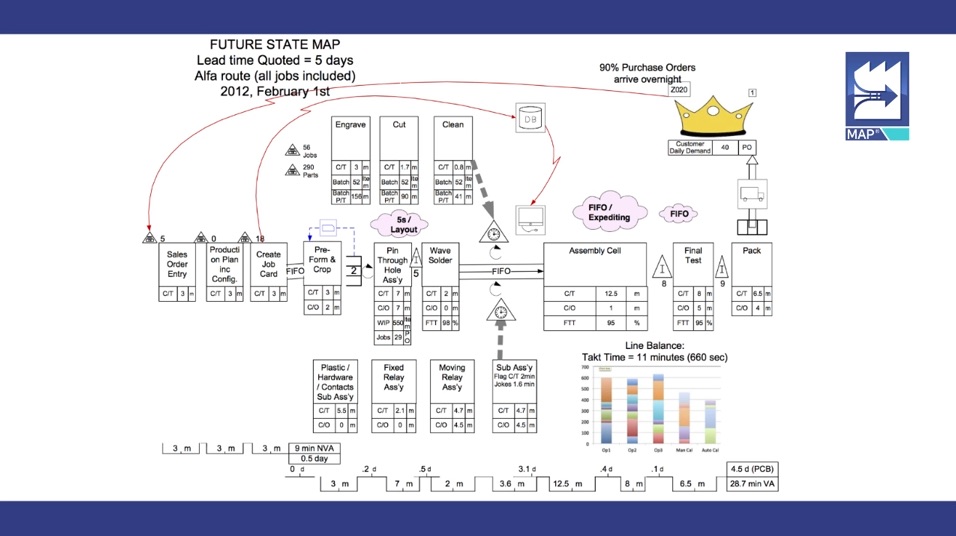
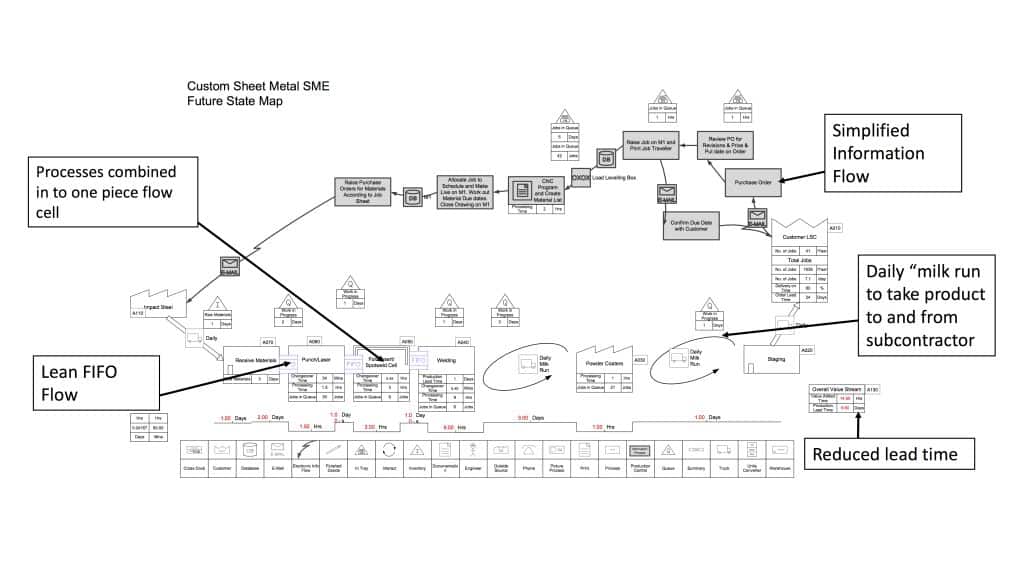
Future State Map
Creating the future state map involves several steps and I won’t explain them in detail here, but they include:
- Calculating the rate of customer demand or takt time.
- Determining the finished goods strategy.
- Working out if you can eliminate processes or combine multiple processes together into a single process with a one-piece flow.
- Where you cannot combine processes working out how they can be connected.
- Determining the point that will be the pacemaker for your process.
- Determining the pitch or planning interval for your process.
- Calculating the overall metrics for your value stream map including the new lead time, inventory levels and the performance level that needs to be achieved at each process.
As you develop your future state map you will highlight several changes that need to be made to your process. You will also highlight areas where process performance needs to be improved if you are to achieve the future state map goals.
These changes and improvements need to be captured. Aim for a future state that can be implemented in 6-9 months. This means that changes that involve massive capital investment, major IT changes or new technology that has not been developed yet, probably need to be left for a future value stream.
Finally. you need to develop an action plan to determine how your future state map will be implemented. This will include the timing and resourcing of all the improvements and changes you highlighted in the future state map.
Once you have implemented your future state map, it becomes your new current state map and the improvement process starts again.
Common Mistakes When Developing Value Stream Maps
I see some common mistakes made in creating value stream maps. These can eliminate many of the benefits of developing value stream maps. These include:
Not going from dock to dock
The real value of a value stream map is that you map your end to end flow, cutting across organisational boundaries. This is how your customer experiences your business. Often, I see attempts to value stream map “departments” within a business.
However, waste usually sits at the interfaces between departments and optimising one department can often create waste in other parts of the flow. It might be easier and avoid corporate politics just to map your own area, but it is probably a waste of time and denies you the main benefits of value stream mapping.
Failing to define processes correctly
A process starts and stops when the flow stops. This usually means that information or a decision is required before the flow of value can continue.
As a result, a single process can include many tasks, provided that, once the sequence of tasks is completed, it can continue without the need for further instruction or information.
For example, an assembly line is usually only one process on a value stream map even though it might include dozens or hundreds of tasks performed by many people. This is because once a product starts on the assembly line it will continue all the way through the line without the need for further information or instruction.
Likewise, a relatively minor single task can be a process if it breaks the flow. For example, a QC check may break the flow if the product cannot move onwards until QC approval is given.
Mixing up Line Balance Charts and Value Stream Maps
Some people will say they value stream map a single work cell.
For the same reason as I explain in my comments about not going dock to dock, a map of a single work cell is not a value stream map. More likely it will be a line balance (yamazumi) chart that is used to balance the work in that work cell and standard work sheets to define the timing, sequence, content and outcomes of the work in that work cell.
Using Incorrect Information in the Current State Map
In the world of IT we say, “garbage in garbage out”. The same applies for value stream maps.
If you make guesses about what your process metrics are, what your customer needs are or poorly define your value stream map boundaries you will end up with a current state map that does not reflect reality or is incomplete.
Then when you go to create your future state, you are likely to come up with recommendations that cannot be implemented or are not optimal.
Narrowing the Scope Too Much
You want your value stream map to have a significant impact on your business and therefore I suggest using the product family matrix method described above to define broad product families.
Choose the product family that has the most impact on your business to map first. It is much easier to adjust the flow of minor products to fit around your major products than visa-versa. There is a school of thought that you should choose just one product to map.
I think this approach is neither necessary or effective. Usually a single product is only a small proportion of your total operation. As well, you are likely to find that the changes you want to make for that product cannot be implemented because of the impact on other products.
“Brainstorming” to Develop the Future State
On the face of it this seems like a good way to go. Ask round the table, get everyone to write up ideas or mind map your way to a future state. The problem with this is that it is usually a recipe for more of the same.
Participants will most likely push the agendas they have always pushed and the ideas will be constrained by the current state of knowledge. It is a good idea to get the team to highlight obvious improvements when the current state is complete. However, creating a true future state is a structured, step by step process as I describe above.
Following those steps will take your team outside its comfort zone, help to neutralise political agendas and most likely lead to an outcome that is much better than anyone in the team expected.
Books About Value Stream Mapping
There are many books on value stream mapping. My recommendation is the best place to start is with “Learning to See”iiby John Shook. This is a very clear, step by step guide to creating a value stream map. If you are a manufacturer, then I highly recommend that you buy the other books in the series including “Creating Continuous Flow”[iii], “Creating Level Pull”[iv] and “Making Materials Flow”[v]. With these four books you really have the tools to create an excellent future state for your business.
If you are in an office environment, I highly recommend “The Complete Lean Enterprise: Value Stream Mapping for Office and Services”[vi]. Again, like Learning to See, this is a very practical, step by step guide to mapping office processes.
If you want something more in-depth for more complex value streams, try “Creating Mixed Model Value Streams: Practical Lean Techniques for Building to Demand”[vii] by Kevin Duggan.
Finally, for an overview of how value stream mapping fits in to the context of your supply chain or small and medium sized business, I cannot help but recommend my own books, “Grow Your Factory, Grow your Profits”[viii] and “On Time In Full”[ix]. Both books provide you insights and case studies about value stream mapping as well as recommendations for further reading.
Do You Need a Consultant or External Facilitator?
In theory, you don’t. Value Stream Mapping is a relatively simple technique and the books I have mentioned I have suggested explain it well. However, there are several benefits of getting outside help. Firstly, value stream maps inevitably cut across multiple organisational boundaries.
Achieving change across functions can be very hard if you belong to one of those functions. A good external consultant is independent of any function within your business and can challenge leaders in every part of your business to make change and contribute to the future state.
Developing the future state can be challenging, having someone around who has done it before can help your team to be bolder and deliver much greater benefits for your business. At the same time the books tend to offer a limited range of solutions for the future state, whereas a good Lean consultant may have seen dozens of futures states and be able to bring innovative solutions from outside your industry that enable you to make a step change improvement.
That said, unfortunately not all Lean “experts” really understand value stream mapping. Therefore, armed with this blog and my recommended reading, make sure that you do challenge them and ensure that they really understand what is a value stream map!
References
[i] Womack, J. P. and Jones. D.T. 2003. Lean Thinking. Free Press.
[ii] Rother, M. and Shook, J. 2003. Learning to See: Value-stream mapping to create value and eliminate muda. Brookline, MA: Lean Enterprise Institute.
[iii] Rother, M. and Harris, R. Creating Continuous Flow: An Action Guide for Manager, Engineers and Production Associates. Brookline, MA: Lean Enterprise Institute, 2001.
[iv] Smalley, Art, Creating Level Pull. Brookline, MA: Lean Enterprise Institute, 2004.
[v] Harris, R., Harris, C. and Wilson, E. 2003. Making Materials Flow: a lean material-handling guide for operations, production-control, and engineering professionals. Cambridge, MA., Lean Enterprise Institute.
[vi] Keyte, B. and Locher, D. The Complete Lean Enterprise: Value Stream Mapping for Office and Services, Second Edition. New York, Productivity Press, 2016.
[vii] Duggan, K. J. 2002. Creating Mixed Model Value Streams: Practical Lean Techniques for Building to Demand, New York, Productivity Press.
[viii] McLean, T. Grow Your Factory, Grow Your Profits: Lean for Small and Medium Sized Manufacturing Enterprises. New York, Productivity Press, 2014.
[ix] McLean, T. On Time In Full: Achieving Perfect Delivery with Lean Thinking in Purchasing, Supply Chain and Production Planning. New York, Productivity Press, 2017.

Author: Timothy McLean
Timothy McLean is the Managing Director of TXM Lean Solutions and is an author of Lean books.