When applying Lean manufacturing principles, in order to improve we have to start with understanding the current manufacturing landscape.
Typically an organisation will have lots of raw data stored in computer programs and reports that can be difficult to work with. Understanding raw data is a key step in taking action towards improvement, so how do we do that.
There are a good number of analytical techniques to use sometimes a simple flowchart or a box load of control charts is needed to bring people together in order to solve a problem.
Each problem is different and which techniques to use may vary from situation to situation. However from a lean view using analytical tools to solve problems is 80% about developing leaders to learn to think differently and 20% on solving the problem. A better leader will solve more problems.
Below are some analytical tools that you can use to gain insights to understand current issues.
Lean tip – Analytical techniques don’t apply themselves and too much analysis leads to paralysis.

Input/Output Analysis
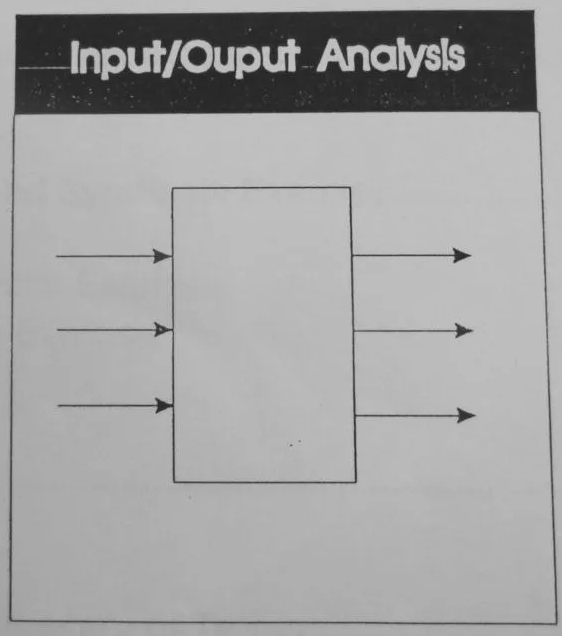 Input/Output analysis is a simple technique used to define a process by examine it interface with the environment or other processes. This analysis start with defining all the inputs required for the process to achieve specified outputs. Like flowcharting it quickly produces a diagram that represent the process.
The Lean tip here is not to describe the sequence of activities required generate the outputs from the inputs. Treat the process a a black box and focus only on the all inputs and all outputs of a process step.
Flowcharting
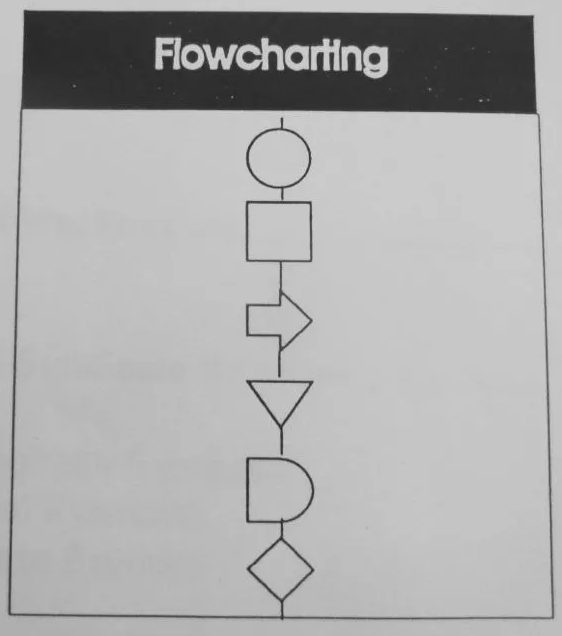 Flowcharting is a simple technique for representing a prices and to then to display a sequence of activities. This help explain their relationships and dependance within the process. In addition it becomes a useful aid to explain, evaluate and to analyse ways to improve the effectiveness of that process. There are many different types of flowcharts, and each type has its own set of conventions.
The two most common types of boxes in a flowchart are a circle for a process step, and a diamond as a decision step. Flowcharts are useful in lean manufacturing as we can clearly separate the value adding operations from the Non-value adding operations.
Pareto Rule
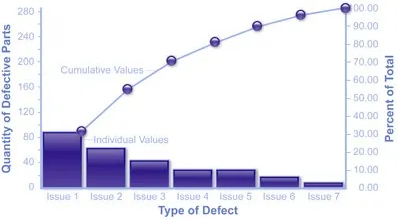 Using the Pareto rule of 80/20 is a useful guide to understanding that the majority of the effect are due to the minority of cause. A simple study of your data may show that the majority of 80% of your profits come from 20% of your customer or;
- 80% of your complaints come from 20% of your customers
- 80% of your sales come from 20% of your products
- 80% of your quality errors are made by 20% of your processes
Therefore, many businesses have use this rule to improve profitability by focusing on the most effective areas and ignoring the rest, of the problems until a later time.

Fishbone (Cause and Effect)
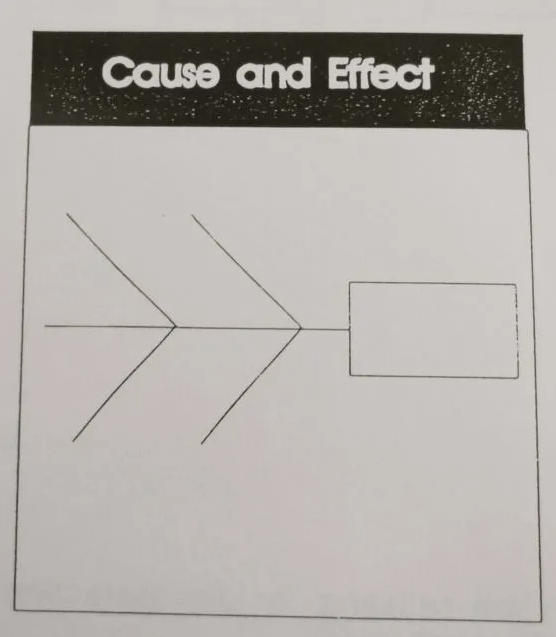 Fishbone diagram may also be referred to as “Cause and Effect” diagram, or Ishikawa diagrams, after their founder Kaoru Ishikawa. Whatever your preferred term, the fishbone diagram is a great tool for delving into a problem when we need to determine the root cause, and you are surrounded by the opinions of those around you.
It provides a process to clearly define the “Effect” and then puts you to thinking about the possible causes, based on the categories of common problems in manufacturing.
Control Charts
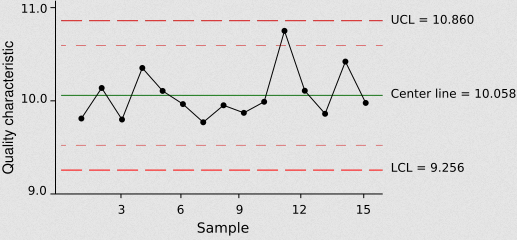 Control charts, are a statistical process control tool that can be used to determine whether a process is in a state of statistical control. Analysis of the control chart data will inform us if the measured process is currently is stable or is not in control. In addition, the trending data can be used to predict the future performance of the process.

Author: Timothy McLean
Timothy McLean is the Managing Director of TXM Lean Solutions and is an author of Lean books.