Mastering Meaningful Metrics
What Do Meaningful Metrics Look Like?
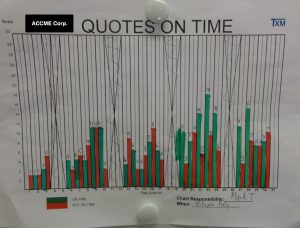
“What gets measured, gets managed” is the adage by management expert Peter Drukker and you would be hard pressed to find a company today that doesn’t have some level of metrics on display throughout the organisation. The challenge is to differentiate between every day “business” metrics and “Lean metrics”. Every company has some level of business metrics – charts that show information, often long after the time period has passed, data has been analysed, extracted from our extensive (and expensive) computer system and proudly put on display to impress a visiting VIP. These charts are often hard to understand, don’t clearly show if things are “good” or “bad” and certainly don’t encourage taking action to improve any “bad” situations. And you know, at a glance if they are simply “wallpaper”; the charts are out of date and covered in dust.
Lean metrics, on the other hand, are an essential part of how our production and management function on a daily basis, providing the information the teams need and highlights to their management where they may need help. Here are a few useful notes on mastering your own meaningful metrics.
Creating Meaningful Metrics
Mark Graban, in his article “The Lean Goals that Matter” talks about the importance to having the right Lean metrics that cover the elements of:
- Safety
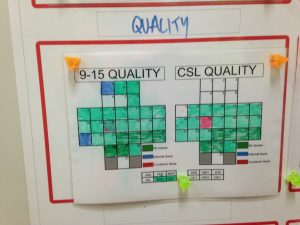
- Quality
- Delivery
- Cost
- Morale
The TXM Visual Management model has a strong focus on these elements. Each company will have a different definition of these elements; each team within the company may also have a slightly different definition of each element. How well they “roll up” to link together that provide company wide metrics is an essential key. However the elements are defined in your company, each elements needs to have clear inputs and outputs, and simply express to the team if they are having a good day; if the team isn’t having a good day, what actions have then taken place to remedy the situation. Updating and interpreting each metics needs to be embedded into the Lean Daily Leadership standard work for each area. Defining each area metrics needs to be done with the team members who can influence these measures with their daily work.
When looking to establish, or refresh the metrics in your Production areas, you need to consider the same 3 questions that we looked at with Visual Controls in your Workplace and in addition to this, you need to consider how to easily identity the GAP in the metrics – where we are and where we want to be – and what ACTION is needed to close this gap. Again, these activities need to be embedded into the Lean Daily Leadership standard work for each area. We also want our Lean metrics to be positive, where practical and show a tangible measure – a number of parts or time elapsed. Try to avoid ratios, percentages or other “efficiency” measures; there are complex to work out and hard to understand.
One of the benefits of having a physical element to your visual management system is that poor results become hard to ignore; having a pile of boxes that are part of a two-bin system and are piling up in the replenishment rack becomes very evident to all that pass that a part of the system isn’t working. This makes it easier to highlight the problem and make sure action to fix the problem is taken.
Using Screens Rather than Physical Metrics
In a recent discussion on the Lean Enterprise Institute website, the question was asked “Are computer screens okay for visual management?” and the response was most interesting. Michael Balle talked about the “physicality of visual management” and how it “creates a common space so that both team members, front line managers and executives can discuss the problem hands-on”.
“Computer visuals are far less intuitive and immediate” Balle continues,” they display a situation but don’t call for action.”
And there is another element of having “physical” metrics; when a person needs to colour in a bar graph or add an number to a metric, they are interacting with the metrics; they internalise what the results are (“we completed 52 widgets today”) and then compare this to the target (“we needed to complete 60 widgets today; we were 8 short”). Then they can begin to understand the gap and how to improve it (“if we hadn’t been short on boxes this morning, we could have made that”) As leaders who are supporting these teams, we need to them help them problem solve, not blame or push issues onto other teams. This can be done by asking the right questions (“what process failed so you didn’t have the boxed you needed?) and supporting them to identify what process improvements are needed.
Sustaining Meaningful Metrics
As with all lean enterprise elements, sustaining, and reviewing and improving, is another key element of mastering meaningful metrics. Lean Leadership standard work at the higher levels needs to include reminders to review metrics to make sure they are still relevant and still easy to update and provide meaningful information to your production teams. Documenting these simple dally processes and including induction training for new team members, even when they are coming form other areas within the company are other vital elements for sustaining your metrics.
If you need help establishing, or refreshing your Lean metrics, give TXM a call; our team of leading Lean Consultants would love to discuss your metrics and visual management needs with you.


